 Hannah T. Belikoff1
 Ramya Walsan
 Cara M. Hildreth
 Jacqueline K. Phillips
- 1Faculty of Medicine, Health and Human Sciences, Macquarie University, Sydney, NSW, Australia
- 2Australian Institute of Health Innovation, Macquarie University, Sydney, NSW, Australia
Introduction: Chronic kidney disease (CKD) and cardiovascular disease are closely interconnected, with cardiovascular disease the leading cause of death for those with CKD. This increased risk for those with CKD is partly attributed to shared risk factors between the conditions. These risk factors differ in presentation between females and males; however, further research is needed to better understand how sex influences cardiovascular risk factors among individuals with CKD.
Methods: Data from the National Health and Nutrition Examination Survey (NHANES) from 2007 to 2018 was utilised. CKD was classified as an albumin-to-creatinine ratio ≥30 mg/g or an estimated glomerular filtration rate (eGFR) <60 ml/min/1.73 m2. Participants were categorized into GFR categories based on their eGFR results for further analysis. Two-way ANOVAs compared means across groups, and a Tukey's post hoc test was performed to assess the statistical significance between group means. Multivariable logistic regression was used to determine the association between cardiovascular risk factors and sex among individuals with and without CKD.
Results: A total of 30,804 participants aged 20 years and older were included, in which 5,528 were classified as having CKD. Our analyses of participants by sex and GFR categories revealed that for both females and males, as renal function declined, systolic blood pressure increased while haemoglobin and haematocrit levels decreased. Multivariate logistic regression revealed that females with CKD demonstrated reduced odds for diabetes (OR: 0.53, CI: 0.42–0.66), hypertension (OR: 0.80, CI: 0.66–0.97), low haematocrit (OR: 0.47, CI: 0.40–0.56), and elevated triglycerides (OR: 0.75, CI: 0.63–0.88), yet exhibited increased odds of a high waist circumference (OR: 1.69, CI: 1.40–2.04) and low high-density lipoprotein cholesterol (HDL-C) (OR: 1.18, CI: 1.00–1.39), compared to males with CKD.
Conclusion: Sex-based differences in cardiovascular risk factors among individuals with CKD reveal that females have lower odds of diabetes, hypertension, low haematocrit and elevated triglycerides, but higher odds of increased waist circumference and low HDL-C compared to males. These findings highlight the need to incorporate sex-specific perspectives into CKD research and management to improve personalized care.
1 Introduction
Chronic kidney disease (CKD), affecting over 850 million individuals globally (1), is closely associated with cardiovascular disease, with individuals facing a significantly elevated risk of cardiovascular events and mortality, particularly in advanced CKD stages (2). This heightened risk arises from both shared traditional risk factors, such as hypertension and diabetes (3), and CKD-specific mechanisms, including uremic toxin accumulation, disturbances in mineral metabolism and inflammatory effects heightened with CKD (4, 5). This overlap substantially increases cardiovascular risk for individuals with CKD, as evidenced by the 2024 United States Renal Data System (USRDS) report, which documented that over 50% of known-cause deaths in dialysis patients were attributed to cardiovascular disease (6), a pattern similarly observed in Australian and New Zealand populations (7). Furthermore, cardiovascular mortality risk increases as kidney function declines, underscoring the complex relationship between CKD and cardiovascular disease (8, 9).
An emerging area of focus is the interplay between CKD and cardiovascular disease and how their etiologies and outcomes differ by sex. While females generally have a lower risk of cardiovascular disease in the general population, this protective effect appears to diminish in the context of CKD (10, 11). For instance, our prior systematic review and meta-analysis demonstrated that females and males with CKD have comparable risks of cardiovascular mortality, challenging conventional assumptions about sex-based differences in cardiovascular health (12). In alignment with these findings, an Australia and New Zealand study evaluating sex differences in mortality among individuals with kidney failure found few differences between the sexes in overall mortality. However, when compared to the general population, female patients with kidney failure exhibited significantly greater excess mortality than their male counterparts, with this disparity most pronounced in deaths caused by cardiovascular disease (13). Sex differences in CKD may be explained by differences in how both traditional and CKD-specific cardiovascular risk factors interact with hormonal differences, socio-economic status, and metabolic responses such as disorders of mineral and bone metabolism, ultimately influencing susceptibility to disease and treatment outcomes (4, 11).
Understanding these sex-based differences is critical for improving the management of CKD-related cardiovascular complications. Despite growing recognition of sex-specific factors in cardiovascular disease risk, it remains unclear how these factors interact with declining renal function or whether they influence treatment efficacy differently in females vs. males. For example, how sex modifies cardiovascular risk factors and their association with declining glomerular filtration rate (GFR) is limited (4). Addressing these gaps is essential for developing tailored prevention and treatment strategies to optimize cardiovascular outcomes for both sexes.
The primary objective of this study is to examine the influence of sex on cardiovascular risk factors, both traditional and CKD-specific, in those with and without CKD, using cross-sectional data from the National Health and Nutrition Examination Survey (NHANES) spanning 2007–2018. Additionally, this study examined how cardiovascular risk factors change with declining renal function in each sex.
2 Materials and methods
2.1 Study population
The NHANES is described in full elsewhere (14). Briefly, it is conducted by the National Center for Health Statistics to assess the nutritional and health status of the United States population, by using a complex, multistage sampling design. The NHANES is a cross-sectional survey with a new cohort of participants in each two-year survey cycle in which it collects data from surveys, physical examinations, and laboratory assessments. All the participants sign an informed consent form. Data for this study were drawn from six NHANES two-year survey cycles from 2007 to 2018. Cardiovascular mortality data were extracted from the NHANES-linked National Death Index file (15), and linked to the NHANES two year survey cycles. Participants were excluded from the study if they were under the age of 20 or had missing serum creatinine, urinary albumin and creatinine values. After excluding these individuals (n = 29,045), the final sample size for the study was 30,804 participants.
2.2 Assessment of CKD
CKD was identified using albumin-to-creatinine ratio (ACR) or estimated glomerular filtration rate (eGFR) (16). eGFR was calculated using the CKD Epidemiology Collaboration equation, which estimates GFR using serum creatinine, age and sex of an individual (17). CKD was classified as an ACR ≥30 mg/g or an eGFR <60 ml/min/1.73 m2 (16). Participants were categorized into different GFR categories as per the KDIGO recommendations for further analysis (16).
2.3 Assessment of risk factors
In the NHANES, interview questions, physical examination and laboratory values were assessed at baseline, per standard NHANES protocol (18). Participants were classified as female or male based on their self-reported responses in the survey. Blood pressure was measured at a mobile examination center with three readings taken after five minutes of seating. The average of the three readings was used to determine systolic and diastolic pressure. Hypertension was defined as systolic blood pressure >140 mmHg, diastolic blood pressure >90 mmHg (19), or self-reported use of antihypertensive medication. Diabetes was identified through self-report. Body mass index (BMI) and waist circumference data were collected in the mobile examination center. Obesity was classified as a BMI of ≥30 kg/m2 (20). High waist circumference was classified as ≥88 cm in females and ≥102 cm in males (21).
Based on the laboratory findings data, elevated triglycerides were classified as ≥150 mg/dl (22), low haemoglobin as <12 g/dl in females or <13 g/dl in males (23), and low haematocrit as <36% for females and <41% for males (24). Low high density lipoprotein-cholesterol (HDL-C) was defined as <50 mg/dl for females and <40 mg/dl for males (25), and hypoalbuminemia was classified as <3.5 g/dl (26).
2.4 Covariates
Age was categorized into three groups: young ages (20–39 years), middle age (40–64 years), or older age (65 years and above) as per previous NHANES studies (27, 28). As per the classifications provided by the NHANES, ethnicity was characterized as white, Mexican American, other Hispanic, African American, or other. Level of education was categorized as less than 9th grade, 9th−11th grade, high school graduate, some college or college graduate and above. Marital status was characterized as married, widowed, divorced, separated, never married, or living with partner. Annual household income was categorized within the brackets of <$US20,000, $US20,000-$US34,999, $US35,000-$US54,999, $US55,000-$US74,999, $US75,000-$US99,999, and above $US100,000. For physical activity, we multiplied the frequency and duration of self-reported recreational vigorous exercise, recreational moderate exercise, work vigorous exercise, work recreational exercise and exercise for transportation. From this, we calculated the number of minutes of physical activity per week by summing up the total amount of reported exercise. Physical activity was characterized as adequate if individuals reported ≥150 min of moderate and/or vigorous exercise per week, as per the World Health Organization 2020 guidelines (29). A history of smoking was identified if participants answered “Yes” to both survey questions: “Have you smoked at least 100 cigarettes in your lifetime?” and “Do you currently smoke cigarettes?”.
2.5 Statistical analysis
Statistical analysis was performed using R version 4.2.2 (30). Appropriate survey weights provided by the NHANES were applied to account for non-response bias, as well as the complex survey design (14). Descriptive statistics described the study sample, including chi-square tests of independence and t-tests to compare socio-demographic characteristics in individuals with and without CKD, including for cardiovascular mortality. The mean [± standard deviation (SD)] of each risk factor was graphed by GFR category and sex, with two-way analysis of variance (ANOVA) tests used to compare means across groups. A Tukey range test for post hoc analysis was performed to identify which specific group means were significantly different from one another, as indicated by the ANOVA results.
Multivariable logistic regression analysis was used to examine the association between binary cardiovascular risk factors [diabetes (Y/N), hypertension (Y/N), obesity (Y/N), high waist circumference (Y/N), elevated triglycerides (Y/N), low haemoglobin (Y/N), low haematocrit (Y/N), low HDL-C (Y/N), and hypoalbuminemia (Y/N)] and sex. Models were run separately for individuals with and without CKD and were adjusted for age, ethnicity, level of education, household income level, marital status, physical activity level and smoking status. Adjusted odds ratios (ORs) and 95% confidence intervals (CIs) were estimated to determine the strength of association between sex and the cardiovascular risk factors in individuals with and without CKD. Statistical significance was set at p ≤ 0.05.
3 Results
3.1 Descriptive statistics
The study sample consisted of 30,804 participants, of which 5,528 (17.9%) individuals had CKD. The mean age of individuals with CKD was 62.9 ± 16.3 years and the mean age for those without CKD was 46.7 ± 16.5 years (p < 0.05). There were 410 (7.4%) cardiovascular deaths among those with CKD and 265 (1.1%) among those without CKD (p < 0.05). Individuals identifying as white comprised the largest group, accounting for 46.1% of individuals with CKD and 40.0% of individuals without CKD (Table 1). African Americans represented the second largest ethnic group, constituting 22.1% of individuals with CKD and 20.2% of those without. The diagnosis of diabetes was reported more frequently among individuals with CKD (31.3%) than those without it (9.1%) (Table 2). The prevalence of hypertension was markedly higher in individuals with CKD (71.3%) compared to individuals without CKD (33.1%). Individuals with CKD had a higher occurrence of low haemoglobin (20.5% vs. 8.1%), low haematocrit (29.9% vs. 14.7%), elevated triglycerides (43.9% vs. 25.1%), and hypoalbuminemia (3.6% vs. 1.7%), compared to individuals without CKD.

Table 1. Demographic characteristics of the study sample, NHANES (2007–2018).

Table 2. Cardiovascular risk factor prevalence for individuals with and without CKD in the sample, NHANES (2007–2018).
3.2 Analysis of risk factors by sex and GFR category
Increasing systolic blood pressure with GFR category was observed for both females and males, with a notable increase above the defined hypertension threshold after G4 (Figure 1). Conversely, diastolic blood pressure did not show a clear relationship with GFR categories (Figure 2). As detailed in Table 3, overall, females had significantly higher mean BMI values compared to males. BMI in females with CKD showed a transient increase above the cut off in category G4 (relative to G1 and G5), while there was no significant GFR category effect for males (Figure 3). There was a significant increase in waist circumference in males with CKD between G1 to G3a, increasing above the cut-off point (Figure 4). In females, there was an increase between G2 and G4, and a decrease in waist circumference at G5 relative to G4. There were no significant changes in HDL-C throughout GFR category (Figure 5), however, females overall exhibited significantly higher mean levels of HDL-C (Table 3).

Figure 1. Systolic blood pressure within each sex by GFR categories, NHANES (2007–2018). Figure illustrates data for systolic blood pressure (SBP; mmHg) for females and males, grouped by GFR category. Dashed line illustrates threshold of 140 mmHg which was used to define if an individual was hypertensive.

Figure 2. Diastolic blood pressure within each sex by GFR category, NHANES (2007–2018). Figure illustrates diastolic blood pressure (DBP; mmHg) for females and males, grouped by GFR category. Dashed line illustrates threshold of 90 mmHg which was used to define if an individual was hypertensive.

Table 3. Mean values of cardiovascular risk factors for females and males with and without CKD, NHANES (2007–2018).

Figure 3. Body mass index within each sex by GFR category, NHANES (2007–2018). Figure illustrates body mass index (BMI; kg/m2) for females and males, grouped by GFR category. Dashed line indicates the cut-off value used in obese classification (30 kg/m2).

Figure 4. Waist circumference within each sex by GFR category, NHANES (2007–2018). Figure illustrates waist circumference (cm) for females and males, grouped by GFR category. Dashed red line indicates the cut-off value used in high waist circumference classification for females (88 cm) and dashed blue line indicates the cut-off value used for males (102 cm).
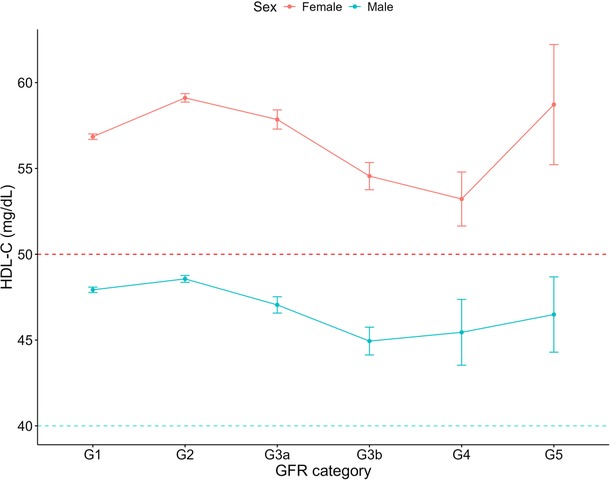
Figure 5. HDL-C within each sex by GFR category, NHANES (2007–2018). Figure illustrates HDL-C (mg/dl) for females and males, grouped by GFR category. Dashed red line indicates the cut-off value used for low HDL-C classification for females (50 mg/dl) and dashed blue line indicates the cut-off value used for males (40 mg/dl).
For both haemoglobin and haematocrit, males overall exhibited higher levels compared to females (Table 3). Haemoglobin and haematocrit declined across all GFR categories for males with CKD (Figures 6, 7). For females with CKD, a decline was evident between G2-G4. At G5, haemoglobin and haematocrit levels were the same in males and females. Albumin levels were shown to decrease as renal function declined in both sexes (Figure 8). Triglycerides significantly increased between G1 and G4 for the females, while in the males, there was no significant difference in triglycerides between GFR categories (Figure 9).

Figure 6. Haemoglobin within each sex by GFR category, NHANES (2007–2018). Figure illustrates haemoglobin (g/dl) for females and males, grouped by GFR category. Dashed red line indicates the cut-off value used for a low haemoglobin classification in females (12 g/dl) and the dashed blue line indicates the cut-off value used for males (13 g/dl).

Figure 7. Haematocrit within each sex by GFR category, NHANES (2007–2018). Figure illustrates haematocrit (%) for females and males, grouped by GFR category. Dashed red line indicates the cut-off value used in low haematocrit classification for females (36%) and dashed blue line indicates the cut-off value used for males (41%).

Figure 8. Albumin within each sex by GFR category, NHANES (2007–2018). Figure illustrates albumin (mg/dl) for females and males, grouped by GFR category. Dashed line indicates the cut-off value used in low albumin (3.5 mg/dl).

Figure 9. Triglycerides within each sex by GFR category, NHANES (2007–2018). Figure illustrates triglycerides (mg/dl) for females and males, grouped by GFR category. Dashed line indicates the cut-off value used in elevated triglycerides (150 mg/dl).
3.3 Assessing sex differences in cardiovascular risk factors among those with and without CKD
Females with CKD demonstrated 46% reduced odds of diabetes (OR: 0.54, CI: 0.43–0.67) and 19% reduced odds of hypertension (OR: 0.81, CI: 0.67–0.98), compared to males with CKD (Table 4). Females with CKD also exhibited reduced odds for low haematocrit (OR: 0.48, CI: 0.40–0.75) and elevated triglycerides (OR: 0.75, CI: 0.63–0.88) compared to males with CKD. Females without CKD exhibited lower odds of diabetes (OR: 0.80, CI: 0.69–0.94), hypertension (OR: 0.85, CI: 0.79–0.91), low haematocrit (OR: 0.86, CI: 0.78–0.96), and elevated triglycerides (OR: 0.55, CI: 0.50–0.60), compared to males without CKD.

Table 4. Multivariable logistic regression of the association between sex and various cardiovascular risk factors in individuals with and without CKD in the sample, NHANES (2007–2018).
Females both with and without CKD exhibited substantially increased odds of a high waist circumference (OR: 1.69, CI: 1.40–2.04 and OR: 2.32, CI: 2.16–2.51, respectively), and low HDL-C (OR: 1.18, CI: 1.00–1.39 and OR: 1.11, CI: 1.02–1.20, respectively) compared to their male counterparts. Additionally, females without CKD exhibited increased odds of having low haemoglobin (OR: 2.70, CI: 2.23–3.28), and hypoalbuminemia (OR: 5.18, CI: 3.70–7.25), compared to males without CKD.
4 Discussion
Our findings reinforce the notion that sex-based disparities in cardiovascular risk are present in individuals with CKD, specifically in how sex affects cardiovascular risk factors and their association with declining renal function. For example, females with CKD exhibited lower odds of diabetes, hypertension, and abnormal lipid profiles compared to males with CKD, yet had higher odds of a high waist circumference and low HDL-C. These results highlight the need for tailored approaches in managing cardiovascular risk in individuals with CKD, considering the distinct profiles of females and males.
Our findings revealed a progressive elevation in systolic blood pressure with advancing CKD in both sexes. This is significant given the association between elevated systolic blood pressure and increased cardiovascular risk (31). For example, a Hong-Kong based retrospective cohort study showed that a 10 mmHg increase in systolic blood pressure is associated with a 11% higher risk of cardiovascular disease (32), and in individuals with CKD, prospective longitudinal studies have shown that a 5 mmHg increase in blood pressure raises the risk of left ventricular hypertrophy by 3% (33). Our data reveal that hypertension affects 71.3% of individuals with CKD, in stark contrast to 33.1% in those without CKD. These results underscore the critical importance of targeted blood pressure management strategies in those with CKD.
Notably, females with and without CKD exhibited odds of hypertension that were 19 and 15 times lower, respectively, than those of their male counterparts. This does align with the literature showing females are at an overall reduced risk of hypertension compared to males (31), though this is impacted by factors such as age (34). While there is less substantive evidence in the CKD population, given the strong links between hypertension and cardiovascular mortality, it does suggest that for hypertension, males are at increased risk (35). This relative reduced risk in females has been attributed to various factors such as sex hormones and renin–angiotensin–aldosterone system mediators, as well as socioeconomic factors like access to health care and adherence to medications (36).
Our analysis revealed that overall, females had higher mean BMI levels than males. However, BMI levels may not be particularly relevant for individuals with kidney disease. Research has indicated an “obesity paradox”, where a higher BMI is associated with better cardiovascular outcomes in those with renal failure (37). Instead, waist circumference and waist-to-hip ratio are considered better indicators of cardiovascular risk (38). Interestingly, our analysis of both BMI and waist circumference by sex and GFR category, revealed a decline in both measures for females at G5 (relative to G4) but not for males. This could be attributed to malnutrition or frailty which is commonly observed in those with CKD, arising from numerous factors including the uremic state, protein energy wasting and reduced food intake (39). Why however, there is a difference between females and males is not clear and warrants further investigation.
Moreover, in our study, while males had an overall higher average waist circumference, females significantly exceeded the high-risk threshold (88 cm vs. 102 cm for males). In a BMI-adjusted model, Postorino et al. revealed that waist circumference was a direct predictor of cardiovascular mortality (40). The strong link between waist circumference and adverse health outcomes suggests an elevated risk for females with CKD, with our data showing they were 1.69 times more likely to have a high waist circumference than their male counterparts, and females without CKD who were 2.32 times more likely to have a high waist circumference. Despite strong evidence that waist circumference provides crucial insights beyond BMI for predicting health outcomes, it is underutilized in clinical settings, representing a missed opportunity for enhanced cardiovascular risk assessment, specifically for females who may face a heightened cardiovascular risk compared to their male counterparts (41).
Our analysis identified a decline in HDL-C between GFR categories G2 and G4, for both sexes and that females with and without CKD showed marginally increased odds of low HDL-C compared to males. Lower HDL-C levels have been considered a risk factor for cardiovascular disease (42), however interventions targeting HDL-C elevation have not reduced cardiovascular events in patients (43). Indeed, higher HDL-C levels have been associated with accelerated GFR decline in middle-aged populations without pre-existing conditions (44). This may be linked to the functionality of HDL particles, whereby inflammatory enzymes, hyperglycaemia and oxidative stress may cause dysfunctional remodelling of the HDL-C particles (44). As such, while HDL-C dysfunction contributes to cardiovascular risk in CKD, therapeutic strategies targeting HDL-C metabolism require further investigation, which will need to consider the effect of sex.
Anaemia, characterized by a reduction in haemoglobin, haematocrit or red blood cell count, is common in kidney disease and typically worsens with disease progression (45, 46). Consistent with this, our data revealed a decline in haemoglobin and haematocrit levels with advancing CKD. Overall, males had significantly higher mean levels of both haemoglobin and haematocrit compared to females. Among individuals without CKD, females showed over double the odds of low haemoglobin compared to males, aligning with previous studies (47). However, our analysis of haemoglobin and haematocrit by sex and GFR category revealed that in patients with renal failure (G5), haemoglobin and haematocrit levels were similar between the sexes. This is likely due to decreased erythropoietin production from reduced renal function (45). Our results suggest that while females without CKD are at greater odds of low haemoglobin, the male advantage diminishes in the context of CKD, as both sexes face a similar likelihood of anaemia. This compares with the KNOW-CKD Korean prospective cohort study, where female patients demonstrated a higher anaemia prevalence in early CKD stages (1–3b) but this sex-based difference disappeared in advanced stages (4–5) (48). We have shown previously that females and males with CKD may have a relatively equal risk of cardiovascular mortality (12), and this data suggest that anaemia as a cardiovascular risk factor, may carry comparable risk for both females and males in advanced CKD. Future research into the impact of anaemia on cardiovascular outcomes in CKD could provide valuable insights and inform more effective management strategies.
Our analysis revealed a decline in albumin as renal function declined, which was evident in both sexes, although the mean albumin levels did not drop below the cutoff value of 3.5 g/dl, which is commonly used to define hypoalbuminemia (26). Low serum albumin is linked to increased risk and poorer outcomes in cardiovascular disease, including heart failure, stroke, and coronary artery disease, independent of traditional risk factors (49). It is a potentially modifiable risk factor, with interventions to raise albumin levels a possible approach for patients with CKD. For example, in another United States based population study, Leon et al. (50) conducted a randomized controlled trial to assess whether addressing nutritional barriers could enhance albumin levels in hemodialysis patients. Their findings demonstrated that personalized nutrition interventions led to improved serum albumin levels among patients with limited nutritional knowledge.
Of note is that in our study, among individuals with CKD, low serum albumin levels did not significantly differ between females and males. Albuminuria, a key marker of kidney damage and progression and is a defining feature of CKD (16). The pathophysiological processes associated with albuminuria include glomerular dysfunction and tubular damage, and are closely associated with endothelial injury and podocyte loss (51). This widespread pathological feature driving persistent protein loss into the urine may obscure potential sex-based differences in albumin metabolism. In contrast, among individuals without CKD, our study identified a significant sex difference, with females exhibiting 5.18 times increased odds of hypoalbuminemia compared to males. Serum albumin levels have been found to decrease in females post-puberty more rapidly than males (52, 53), which may explain our findings.
Our analysis found that females with and without CKD had 50% and 20% lower odds of diabetes compared to males, respectively. Our data thus shows that males face a greater diabetes burden, both in the presence and absence of CKD, with the disparity being slightly more pronounced among those with CKD. This aligns with other studies such as Nordstrom et al.'s Swedish based prospective population study of older age individuals, which found that males were at almost double the risk of type 2 diabetes than older females (54). However, findings on the relationship between sex, diabetes and CKD are not consistent across all studies. For example, Yang et al's large-scale cross-sectional study in Shanghai reported that females with CKD were more likely to have diabetes than males (55). There is a complex interrelationship with diabetes and CKD, with diabetic kidney disease being the primary cause of CKD (56). Why diabetes and CKD present differently in females and males has been attributed to variations in sex hormone signaling, renal glucose handling, and gene expression, and how these factors influence susceptibility to hyperglycemia, glomerular hyperfiltration, vascular health and disease progression (57). Our data underscore the importance of considering sex differences in the management of diabetes as a cardiovascular risk factor in individuals with CKD. Future research should investigate how sex-specific factors influence glycemic control and the efficacy of diabetes treatments, such as SGLT2 inhibitors and GLP-1 receptor agonists, which have demonstrated cardiorenal benefits (58). Additionally, exploring disparities in glycemic and cardiovascular risk management including blood pressure control between sexes is crucial, as women with diabetes are often undertreated (59). This will allow personalized strategies for both impacting modifiable risk factors and improving outcomes in both females and males with CKD and diabetes (59).
The NHANES database is robust due to its large sample size of over 30,000 participants and its use of weightings to address oversampling and bias and to ensure representativeness. It benefits from objective measurements and for our purposes, a reduction in selection bias as the sample isn't specifically chosen for CKD assessment. However, there are notable limitations. The reliance on self-reported data introduces potential recall and response biases, which may affect accuracy. Further, the NHANES uses a single measurement for a variety of biomarkers, including those used for assessing renal function. This method differs from KDIGO's 2024 guidelines which recommend measurements over a 3-month period (16). This could lead to misclassifying episodes of acute kidney injury as CKD. Additionally, the cross-sectional nature of the NHANES introduces limitations in the study, such as the inability to determine cause-and-effect relationships (60). Moreover, while we accounted for ethnicity in our analyses, we did not explore potential interactions between sex and ethnicity in relation to cardiovascular risk factors. Given the potential impact of these interactions on cardiovascular outcomes, future research should investigate how sex and ethnicity together may contribute to disparities in cardiovascular health.
In conclusion, this cross-sectional study reveals sex-based differences in cardiovascular risk factors in individuals with CKD and further that many of these risk factors change significantly in their presentation across the course of disease progression in both sexes. Using this more nuanced understanding of the variability of these risk factors is crucial for mitigating their impact on cardiovascular mortality in females with CKD, especially considering that the effects of CKD on females have often been underestimated to date (4). This work adds to the body of evidence that challenges the conventional understanding of sex disparities in cardiovascular risk and emphasize the importance of integrating sex-specific perspectives into both CKD research and management to enhance personalized care.
Data availability statement
Publicly available datasets were analyzed in this study. This data can be found here: https://wwwn.cdc.gov/nchs/nhanes/Default.aspx.
Ethics statement
The studies involving humans were approved by NCHS Research Ethics Review Board (ERB). The studies were conducted in accordance with the local legislation and institutional requirements. The participants provided their written informed consent to participate in the NHANES study.
Author contributions
HB: Data curation, Formal analysis, Investigation, Visualization, Writing – original draft, Writing – review & editing. RW: Conceptualization, Data curation, Formal analysis, Investigation, Methodology, Supervision, Visualization, Writing – review & editing. CH: Conceptualization, Supervision, Visualization, Writing – review & editing. JP: Conceptualization, Supervision, Visualization, Writing – review & editing, Project administration, Resources, Validation, Investigation.
Funding
The author(s) declare that financial support was received for the research and/or publication of this article. This work was supported by the Hillcrest Foundation. HTB was supported by a Macquarie University Research Excellence Stipend Scholarship.
Acknowledgments
We thank the NHANES survey teams and study participants for their contributions.
Conflict of interest
The authors declare that the research was conducted in the absence of any commercial or financial relationships that could be construed as a potential conflict of interest.
Generative AI statement
The author(s) declare that no Generative AI was used in the creation of this manuscript.
Publisher's note
All claims expressed in this article are solely those of the authors and do not necessarily represent those of their affiliated organizations, or those of the publisher, the editors and the reviewers. Any product that may be evaluated in this article, or claim that may be made by its manufacturer, is not guaranteed or endorsed by the publisher.
References
1. GBD Chronic Kidney Disease Collaboration. Global, regional, and national burden of chronic kidney disease, 1990–2017: a systematic analysis for the global burden of disease study 2017. Lancet. (2020) 395(10225):709–33. doi: 10.1016/S0140-6736(20)30045-3
2. Luyckx VA, Tonelli M, Stanifer JW. The global burden of kidney disease and the sustainable development goals. Bull World Health Organ. (2018) 96(6):414–22D. doi: 10.2471/BLT.17.206441
3. Parikh NI, Hwang SJ, Larson MG, Meigs JB, Levy D, Fox CS. Cardiovascular disease risk factors in chronic kidney disease: overall burden and rates of treatment and control. Arch Intern Med. (2006) 166(17):1884–91. doi: 10.1001/archinte.166.17.1884
4. Wyld MLR, Mata NL, Viecelli A, Swaminathan R, O’Sullivan KM, O'Lone E, et al. Sex-based differences in risk factors and complications of chronic kidney disease. Semin Nephrol. (2022) 42(2):153–69. doi: 10.1016/j.semnephrol.2022.04.006
5. Vondenhoff S, Schunk SJ, Noels H. Increased cardiovascular risk in patients with chronic kidney disease. Herz. (2024) 49(2):95–104. doi: 10.1007/s00059-024-05235-4
6. United States Renal Data System. 2024 USRDS Annual Data Report: Epidemiology of Kidney Disease in the United States. Bethesda, MD: National Institutes of Health, National Institute of Diabetes and Digestive and Kidney Diseases (2024). Chapter 6
7. ANZDATA Registry. 46th Report, Chapter 3: Mortality in Kidney Failure with Replacement Therapy. (2023).
8. Jankowski J, Floege J, Fliser D, Bohm M, Marx N. Cardiovascular disease in chronic kidney disease: pathophysiological insights and therapeutic options. Circulation. (2021) 143(11):1157–72. doi: 10.1161/CIRCULATIONAHA.120.050686
9. Ryan TP, Fisher SG, Elder JL, Winters PC, Beckett W, Tacci J, et al. Increased cardiovascular risk associated with reduced kidney function. Am J Nephrol. (2009) 29(6):620–5. doi: 10.1159/000194455
10. Astley M, Caskey FJ, Evans M, Torino C, Szymczak M, Drechsler C, et al. The impact of gender on the risk of cardiovascular events in older adults with advanced chronic kidney disease. Clin Kidney J. (2023) 16(12):2396–404. doi: 10.1093/ckj/sfad088
11. Balafa O, Fernandez-Fernandez B, Ortiz A, Dounousi E, Ekart R, Ferro CJ, et al. Sex disparities in mortality and cardiovascular outcomes in chronic kidney disease. Clin Kidney J. (2024) 17(3):sfae044. doi: 10.1093/ckj/sfae044
12. Shajahan S, Amin J, Phillips JK, Hildreth CM. Relationship between sex and cardiovascular mortality in chronic kidney disease: a systematic review and meta-analysis. PLoS One. (2021) 16(7):e0254554. doi: 10.1371/journal.pone.0254554
13. De La Mata NL, Rosales B, MacLeod G, Kelly PJ, Masson P, Morton RL, et al. Sex differences in mortality among binational cohort of people with chronic kidney disease: population based data linkage study. Br Med J. (2021) 375:e068247. doi: 10.1136/BMJ-2021-068247
14. Centers for Disease Control and Prevention. About NHANES National Centre for Health Statistics (2023). Available at: https://www.cdc.gov/nchs/nhanes/about_nhanes.htm (Accessed January 30, 2023).
15. CDC. Public-Use files (2022). Available at: https://www.cdc.gov/nchs/data-linkage/mortality-public.htm (Accessed January 30, 2023).
16. Kidney Disease: Improving Global Outcomes CKDWG. Kdigo 2024 clinical practice guideline for the evaluation and management of chronic kidney disease. Kidney Int. (2024) 105(4S):S117–314. doi: 10.1016/j.kint.2023.10.018
17. Levey AS, Stevens LA, Schmid CH, Zhang YL, Castro AF, Feldman HI, et al. A new equation to estimate glomerular filtration rate. Ann Intern Med. (2009) 150(9):604–12. doi: 10.7326/0003-4819-150-9-200905050-00006
18. Centers for Disease Control and Prevention. Laboratory data overview National Centre for Health Statistics. Available at: https://wwwn.cdc.gov/nchs/nhanes/continuousnhanes/overviewlab.aspx?BeginYear=2009 (Accessed January 30, 2023).
19. Unger T, Borghi C, Charchar F, Khan NA, Poulter NR, Prabhakaran D, et al. 2020 international society of hypertension global hypertension practice guidelines. Hypertension. (2020) 75(6):1334–57. doi: 10.1161/HYPERTENSIONAHA.120.15026
20. WHO Expert Committee. Physical Status: the use and interpretation of anthropometry. Report of a WHO expert committee (WHO technical report series; 854). Geneva: World Health Organization (1995). Available at: https://iris.who.int/handle/10665/37003
21. Lean ME, Han TS, Morrison CE. Waist circumference as a measure for indicating need for weight management. Br Med J. (1995) 311(6998):158–61. doi: 10.1136/bmj.311.6998.158
22. Expert Panel on Detection Evaluation Treatment of High Blood Cholesterol in Adults. Executive summary of the third report of the national cholesterol education program (NCEP) expert panel on detection, evaluation, and treatment of high blood cholesterol in adults (adult treatment panel III). JAMA. (2001) 285(19):2486–97. doi: 10.1001/jama.285.19.2486
23. World Health Organization. Guideline on Haemoglobin Cutoffs to Define Anaemia in Individuals and Populations. Geneva: World Health Organization: Vitamin and Mineral Nutrition Information System (2024). Available at: http://www.who.int/vmnis/indicators/haemoglobin.pdf
24. Dean L, National Center for Biotechnology Information (U.S.). Blood Groups and Red Cell Antigens. Bethesda, Md.: NCBI (2005). Available at: https://www.ncbi.nlm.nih.gov/books/NBK2261
25. Grundy SM, Stone NJ, Bailey AL, Beam C, Birtcher KK, Blumenthal RS, et al. 2018 Aha/acc/aacvpr/aapa/abc/acpm/Ada/ags/apha/aspc/nla/pcna guideline on the management of blood cholesterol: a report of the American College of Cardiology/American Heart Association task force on clinical practice guidelines. J Am Coll Cardiol. (2019) 73(24):e285–350. doi: 10.1016/j.jacc.2018.11.003
26. Walker HK, Hall WD, Hurst JW. Clinical Methods: The History, Physical, and Laboratory Examinations. 3rd ed. Boston: Butterworths (1990).
27. Shin JI, Wang D, Fernandes G, Daya N, Grams ME, Golden SH, et al. Trends in receipt of American diabetes association guideline-recommended care among U.S. Adults with diabetes: NHANES 2005–2018. Diabetes Care. (2021) 44(6):1300–8. doi: 10.2337/dc20-2541
28. Shay CM, Ning H, Allen NB, Carnethon MR, Chiuve SE, Greenlund KJ, et al. Status of cardiovascular health in US adults: prevalence estimates from the national health and nutrition examination surveys (NHANES) 2003–2008. Circulation. (2012) 125(1):45–56. doi: 10.1161/CIRCULATIONAHA.111.035733
29. Bull FC, Al-Ansari SS, Biddle S, Borodulin K, Buman MP, Cardon G, et al. World health organization 2020 guidelines on physical activity and sedentary behaviour. Br J Sports Med. (2020) 54(24):1451–62. doi: 10.1136/bjsports-2020-102955
30. R Core Team. R: A Language and Environment for Statistical Computing. Vienna, Austria: R Foundation for Statistical Computing (2023). Available at: https://www.R-project.org/
31. Williams B, Mancia G, Spiering W, Agabiti Rosei E, Azizi M, Burnier M, et al. 2018 ESC/ESH guidelines for the management of arterial hypertension. Eur Heart J. (2018) 39(33):3021–104. doi: 10.1093/eurheartj/ehy339
32. Wan EYF, Yu EYT, Chin WY, Fong DYT, Choi EPH, Lam CLK. Association of blood pressure and risk of cardiovascular and chronic kidney disease in Hong Kong hypertensive patients. Hypertension. (2019) 74(2):331–40. doi: 10.1161/HYPERTENSIONAHA.119.13123
33. Levin A, Singer J, Thompson CR, Ross H, Lewis M. Prevalent left ventricular hypertrophy in the predialysis population: identifying opportunities for intervention. Am J Kidney Dis. (1996) 27(3):347–54. doi: 10.1016/s0272-6386(96)90357-1
34. Connelly PJ, Currie G, Delles C. Sex differences in the prevalence, outcomes and management of hypertension. Curr Hypertens Rep. (2022) 24(6):185–92. doi: 10.1007/s11906-022-01183-8
35. Weldegiorgis M, Woodward M. The impact of hypertension on chronic kidney disease and End-stage renal disease is greater in men than women: a systematic review and meta-analysis. BMC Nephrol. (2020) 21(1):506. doi: 10.1186/s12882-020-02151-7
36. Sandberg K, Ji H. Sex differences in primary hypertension. Biol Sex Differ. (2012) 3(1):7. doi: 10.1186/2042-6410-3-7
37. Park J, Ahmadi SF, Streja E, Molnar MZ, Flegal KM, Gillen D, et al. Obesity paradox in End-stage kidney disease patients. Prog Cardiovasc Dis. (2014) 56(4):415–25. doi: 10.1016/j.pcad.2013.10.005
38. Zimmermann S, Mathew A, Schoppe R, Mangova G, Biemann R, Surov A, et al. Fat tissue quantity, waist circumference or waist-to-hip ratio in patients with chronic kidney disease: a systematic review and meta-analysis. Obes Res Clin Pract. (2024) 18(2):81–7. doi: 10.1016/j.orcp.2024.03.007
39. Tseng PW, Lin TY, Hung SC. Association of frailty with nutritional status in patients with chronic kidney disease. J Ren Nutr. (2024) 34(2):133–40. doi: 10.1053/j.jrn.2023.09.003
40. Postorino M, Marino C, Tripepi G, Zoccali C, Group CW. Abdominal obesity and all-cause and cardiovascular mortality in end-stage renal disease. J Am Coll Cardiol. (2009) 53(15):1265–72. doi: 10.1016/j.jacc.2008.12.040
41. Ross R, Neeland IJ, Yamashita S, Shai I, Seidell J, Magni P, et al. Waist circumference as a vital sign in clinical practice: a consensus statement from the IAS and ICCR working group on visceral obesity. Nat Rev Endocrinol. (2020) 16(3):177–89. doi: 10.1038/s41574-019-0310-7
42. Du Z, Qin Y. Dyslipidemia and cardiovascular disease: current knowledge, existing challenges, and new opportunities for management strategies. J Clin Med. (2023) 12(1):363. doi: 10.3390/jcm12010363
43. Keene D, Price C, Shun-Shin MJ, Francis DP. Effect on cardiovascular risk of high density lipoprotein targeted drug treatments niacin, fibrates, and CETP inhibitors: meta-analysis of randomised controlled trials including 117,411 patients. Br Med J. (2014) 349:g4379. doi: 10.1136/bmj.g4379
44. Melsom T, Norvik JV, Enoksen IT, Stefansson V, Rismo R, Jenssen T, et al. Association of high-density lipoprotein cholesterol with GFR decline in a general nondiabetic population. Kidney Int Rep. (2021) 6(8):2084–94. doi: 10.1016/j.ekir.2021.05.007
45. Iseki K, Kohagura K. Anemia as a risk factor for chronic kidney disease. Kidney Int Suppl. (2007) 107:S4–9. doi: 10.1038/sj.ki.5002481
46. Khan MN, Elderdery A. Alterations of hematological parameters, hemoglobin and hematocrit with liver enzymes, aspartate transaminase and alanine transaminase among patients with chronic kidney disease undergoing hemodialysis in Aljouf region, Saudi Arabia. J Hematol. (2018) 7(1):1–6. doi: 10.14740/jh367w
47. Wang C, Wang Y. Trends in prevalence and treatment rate of anemia in the U.S. population: cross-sectional study using data from NHANES 2005–2018. Hematology. (2022) 27(1):881–8. doi: 10.1080/16078454.2022.2109557
48. Ryu SR, Park SK, Jung JY, Kim YH, Oh YK, Yoo TH, et al. The prevalence and management of anemia in chronic kidney disease patients: result from the Korean cohort study for outcomes in patients with chronic kidney disease (know-ckd). J Korean Med Sci. (2017) 32(2):249–56. doi: 10.3346/jkms.2017.32.2.249
49. Arques S. Serum albumin and cardiovascular disease: state-of-the-art review. Ann Cardiol Angeiol (Paris. (2020) 69(4):192–200. doi: 10.1016/j.ancard.2020.07.012
50. Leon JB, Albert JM, Gilchrist G, Kushner I, Lerner E, Mach S, et al. Improving albumin levels among hemodialysis patients: a community-based randomized controlled trial. Am J Kidney Dis. (2006) 48(1):28–36. doi: 10.1053/j.ajkd.2006.03.046
51. Claudel SE, Verma A. Albuminuria in cardiovascular, kidney, and metabolic disorders: a state-of-the-art review. Circulation. (2025) 151(10):716–32. doi: 10.1161/CIRCULATIONAHA.124.071079
52. Soeters PB, Wolfe RR, Shenkin A. Hypoalbuminemia: pathogenesis and clinical significance. JPEN J Parenter Enteral Nutr. (2019) 43(2):181–93. doi: 10.1002/jpen.1451
53. Weaving G, Batstone GF, Jones RG. Age and sex variation in serum albumin concentration: an observational study. Ann Clin Biochem. (2016) 53(Pt 1):106–11. doi: 10.1177/0004563215593561
54. Nordstrom A, Hadrevi J, Olsson T, Franks PW, Nordstrom P. Higher prevalence of type 2 diabetes in men than in women is associated with differences in visceral fat mass. J Clin Endocrinol Metab. (2016) 101(10):3740–6. doi: 10.1210/jc.2016-1915
55. Yang Y, Wang N, Jiang Y, Zhao Q, Chen Y, Ying X, et al. The prevalence of diabetes mellitus with chronic kidney disease in adults and associated factors in Songjiang district, Shanghai. Ann Palliat Med. (2021) 10(7):7214–24. doi: 10.21037/apm-21-803
56. ANZDATA. Anzdata 47 Annual Report 2024 (Data Survey 2023) (2024). Available at: https://www.anzdata.org.au/report/anzdata-47th-annual-report-2024-data-survey-2023/ (Accessed December 24, 2024).
57. Shepard BD. Sex differences in diabetes and kidney disease: mechanisms and consequences. Am J Physiol Renal Physiol. (2019) 317(2):F456–62. doi: 10.1152/ajprenal.00249.2019
58. Sharma A, Wood S, Bell JS, De Blasio MJ, Ilomaki J, Ritchie RH. Sex differences in risk of cardiovascular events and mortality with sodium glucose co-transporter-2 inhibitors versus glucagon-like peptide 1 receptor agonists in Australians with type 2 diabetes: a population-based cohort study. Lancet Reg Health West Pac. (2023) 33:100692. doi: 10.1016/j.lanwpc.2023.100692
59. Regensteiner JG, Golden S, Huebschmann AG, Barrett-Connor E, Chang AY, Chyun D, et al. Sex differences in the cardiovascular consequences of diabetes mellitus: a scientific statement from the American Heart Association. Circulation. (2015) 132(25):2424–47. doi: 10.1161/CIR.0000000000000343
Keywords: chronic kidney disease, cardiovascular risk factors, sex-differences, NHANES, hypertension, anaemia, diabetes
Citation: Belikoff HT, Walsan R, Hildreth CM and Phillips JK (2025) Differential cardiovascular risk profiles by sex among adults with CKD: a NHANES-based analysis. Front. Cardiovasc. Med. 12:1544590. doi: 10.3389/fcvm.2025.1544590
Received: 13 December 2024; Accepted: 11 April 2025;
Published: 2 May 2025.
Edited by:
Heather-Jean Foulds, University of Saskatchewan, CanadaReviewed by:
Audrey Adji, Victor Chang Cardiac Research Institute, AustraliaAmanda Froehlich Choe, University of Saskatchewan, Canada
Copyright: © 2025 Belikoff, Walsan, Hildreth and Phillips. This is an open-access article distributed under the terms of the Creative Commons Attribution License (CC BY). The use, distribution or reproduction in other forums is permitted, provided the original author(s) and the copyright owner(s) are credited and that the original publication in this journal is cited, in accordance with accepted academic practice. No use, distribution or reproduction is permitted which does not comply with these terms.
*Correspondence: Jacqueline K. Phillips, amFjcXVlbGluZS5waGlsbGlwc0BtcS5lZHUuYXU=